 AIDataLegends
Databricks SQL Serverless Cost Governance: Budgets, Alerts, and Query-Level Attribution
Databricks adds budgets, billing system tables and usage dashboards to make SQL Serverless spend easier to explain. But budgets are not spending caps, estimates are not invoices, and useful attribution depends on consistent tagging and operational controls.

Serverless compute can simplify warehouse operations, but it does not make cloud spending self-governing. A warehouse can scale to meet demand, a dashboard can trigger a burst of queries, and a poorly timed refresh can consume resources long after its value has diminished.
Databricks is addressing the visibility side of this problem with account-level budgets, alerts, billing system tables, and usage dashboards. Its recommended SQL Serverless warehouse experience is designed to reduce operational overhead through rapid startup and automatic scaling. Yet teams still need to understand what they are spending, which workloads are responsible, and what happens when spending exceeds expectations.
That last point matters: a budget is a monitoring target, not a hard spending limit. Databricks says it plainly: budgets “don’t stop usage or prevent charges.” An alert can tell your team that costs are rising, but the response still depends on the controls and workflows you put around the platform.
For data and AI engineers, the practical question is not simply how to view a bill. It is how to build a cost-governance system that connects resource usage to ownership, workload behavior, and corrective action.
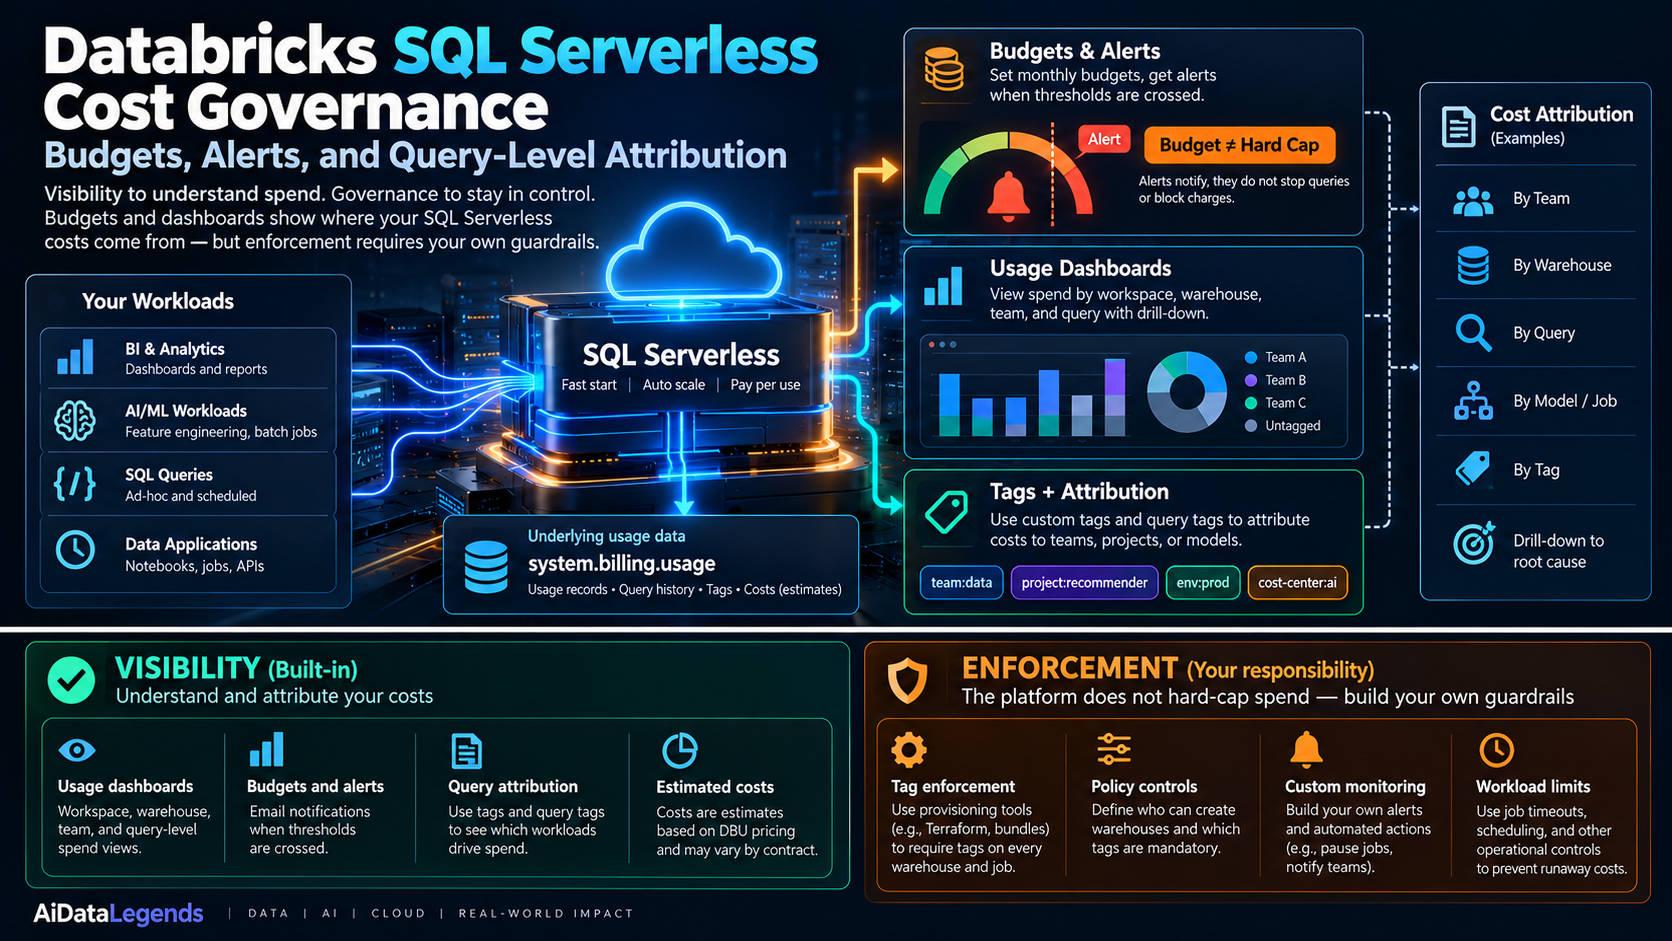
Visibility is built in; enforcement is yours: budgets, dashboards and tags show where SQL Serverless spend comes from, while guardrails stop it.
Why serverless cost governance matters
SQL warehouses often serve unpredictable, interactive workloads: BI dashboards, ad hoc analysis, embedded analytics, scheduled reporting, and data applications. A busy reporting period or a newly deployed dashboard can create a sharp increase in query volume. A warehouse may be configured correctly and still process far more work than the team anticipated.
Without attribution, the resulting bill becomes a detective exercise. Engineers have to work backward from aggregate usage to identify which warehouse, team, dashboard, or query drove the increase. By then, the workload may have completed and the opportunity to intervene may have passed.
Databricks’ cost-management guidance brings several capabilities together:
- Attribution: use resource tags and billing metadata to associate usage with teams, projects, and workloads.
- Budgets: define spending targets for an account or selected groups of resources.
- Alerts: notify owners when spending crosses a threshold or when a custom query detects a concerning trend.
- Dashboards: inspect usage patterns and drill down into cost drivers.
- Optimization: reduce unnecessary execution, data scanning, and refresh activity.
The first four improve observability. Optimization and operational controls are what turn that visibility into lower costs.
What Databricks is adding to the cost-governance workflow
Databricks’ guidance, published on October 7, 2026 by Shweta Verma and Lingeshwaran Kanniappan, describes a more proactive approach to SQL warehouse cost management. Instead of waiting for a monthly invoice, teams can combine budgets, usage records, alerts, and dashboards to identify spending patterns earlier. The post recommends tagging every SQL warehouse with team, cost centre, and use case at creation, monitoring attribution through system.billing.usage to drive unattributed spend to zero, and setting layered budgets: per-team for accountability, account-wide as a safety net. (Databricks cost-governance guidance)
The accompanying usage dashboards provide account- and workspace-level views of usage, including breakdowns by product, SKU, and custom tags. Dashboard version 2.0 is marked Preview in the documentation and adds cost forecasting and object-level cost drill-down. Access requires the relevant Unity Catalog-enabled workspace and SELECT permissions on the billing usage and list-prices system tables. (Databricks usage dashboards documentation)
These capabilities improve the feedback loop, but they do not eliminate the need for engineering controls. A forecast is not a guarantee, a budget alert is not an automatic shutdown, and a dashboard cannot attribute usage reliably when the metadata needed to connect costs to ownership is missing.
1. Understand what budgets can and cannot do
A Databricks budget tracks usage against a configured target and can notify designated recipients when its threshold is reached. It is useful for detecting overspending, but it does not, by itself, stop a query, suspend a warehouse, or prevent further charges.
That distinction should shape how teams design their response.
Imagine a BI team has a monthly warehouse budget of $5,000. A new dashboard launches, query concurrency increases, and the team is projected to exceed its target halfway through the month. The budget can make the problem visible, but someone (or an independently configured automation) must decide whether to optimize the dashboard, adjust refresh frequency, change warehouse settings, or temporarily restrict a workload.
A practical budget design has at least two layers:
| Budget layer | Purpose | Example response |
|---|---|---|
| Team or workload budget | Make spending ownership explicit | Review expensive queries and refresh schedules |
| Account-wide budget | Detect broad anomalies and unassigned usage | Escalate to platform engineering and FinOps |
Budgets work best when they are paired with a response policy. Define who receives an alert, how quickly it must be reviewed, what evidence is collected, and which actions are allowed without additional approval.
Do not describe a budget threshold as a guaranteed maximum bill. If your organization needs stronger protection against runaway workloads, combine budget monitoring with execution timeouts, workload restrictions, controlled provisioning, and alerts that trigger an explicitly designed response.
2. Build attribution from resource tags and billing records
The system.billing.usage table is a key source for analyzing Databricks billable usage. It contains usage records and metadata that can help teams investigate resource consumption and associate it with custom tags. The system.billing.list_prices table can provide price-list context for cost estimates. See the Databricks cost-management documentation.
Attribution starts with a consistent vocabulary. Consider tagging warehouses or applicable compute resources with dimensions such as:
team: the team accountable for the workloadcost_center: the business unit paying for itenvironment: production, staging, or developmentuse_case: BI serving, ad hoc analysis, scheduled reporting, or model evaluation
Choose a small, documented taxonomy and apply it consistently. Otherwise, values such as Analytics, analytics-team, and DataAnalytics may fragment reporting for what is effectively the same owner.
Databricks documentation describes custom-tag enforcement through compute policies. It also documents serverless usage policies for tagging serverless workloads, a capability marked Public Preview. The correct enforcement mechanism depends on the resource type and feature availability in your workspace. See Use tags to attribute and track usage.
This is an important distinction: tag enforcement is not limited to manual discipline. However, teams still need to configure the appropriate policy, account for supported resource types, and ensure that their provisioning process applies the required metadata.
Warehouse attribution is not query attribution
Warehouse-level tags answer a question such as, “Which team owns this warehouse’s usage?” They do not necessarily explain which individual query or dashboard caused a spike inside a shared warehouse, where one BI warehouse may serve dozens of dashboards, several dbt models, and a stream of ad hoc queries.
For finer-grained analysis, Databricks points to query tags (Public Preview), which attach business context to individual SQL statements and land in a query_tags column you can join with query history. Correlate that query metadata with billing data where the available identifiers and time dimensions allow it.
This correlation needs care. Billing usage is not automatically a perfect invoice line for every SQL statement. Shared compute, overlapping execution, different usage dimensions, and the relationship between query history and billing intervals can complicate attribution. Treat per-query cost as a model that should be documented and validated, not as an unquestionable chargeback figure.
For dbt workloads, model-level query metadata can be particularly useful. Verify which query-tagging behavior your installed dbt-databricks version supports, then test whether the metadata appears in the history and system tables you use for reporting. Do not assume that model names automatically appear in every billing record.
3. Use alerts to detect spending before month-end
A monthly threshold tells you when a target has been reached. A pacing alert attempts to tell you whether the current trajectory is likely to exceed that target.
That difference can provide more time to respond.
A useful alerting setup combines:
- Threshold alerts when actual usage or estimated spend crosses a defined level.
- Pacing alerts when the current trend projects a month-end overrun.
- Anomaly alerts when daily usage departs significantly from a workload’s normal pattern.
- Attribution alerts when usage is missing expected ownership metadata.
Custom SQL alerts can be built around system.billing.usage, but the query must account for the usage dimensions, pricing assumptions, and time window relevant to the workload. Validate alert calculations against the account’s own billing data before using them for financial reporting.
An alert also needs an owner and a playbook. For example:
- A sharp rise in BI serving spend triggers a review of dashboard refresh rates and concurrency.
- A scheduled workload exceeding its normal run cost triggers a comparison of query plans, data volume, and recent code changes.
- A rise in unattributed usage triggers a review of provisioning policies and missing tags.
- A projected monthly overrun triggers a review with the workload owner before any production changes are made.
Avoid automatically stopping production workloads based on an estimated cost signal unless the business has explicitly accepted the consequences. Cost controls should protect budgets without creating a more expensive reliability incident.
4. Read usage dashboards with the right caveats
The prebuilt Databricks usage dashboards help administrators explore usage by product, SKU, and custom tags. They can be customized and shared like other dashboards, making them useful for platform teams, engineering managers, and FinOps stakeholders.
There are several details worth remembering:
- Permissions matter. Users need
SELECTaccess tosystem.billing.usageandsystem.billing.list_pricesto use the imported dashboards. - Retention matters. Dashboard history is subject to the retention policies of the underlying usage table, and since October 7, 2026, usage data for deleted workspaces is no longer available. If you need a longer internal history, plan and validate your own retention and export strategy.
- Displayed costs are estimates. The Consumption (Legacy) view allows the price per DBU to be adjusted because actual pricing varies by contract. Do not treat a configurable estimate as a final invoice.
- Aggregated downloads can hide detail. The aggregated CSV export includes the 999 highest-usage workspaces, SKUs, or tag values; the remaining values are combined. Use the unaggregated date-range download or system tables when you need a complete view.
These are not reasons to avoid dashboards. They are reasons to understand what a dashboard represents before using it for chargeback, budget decisions, or audit evidence.
The official documentation is the best place to verify current dashboard versions, access requirements, and export behavior: Usage dashboards | Databricks on AWS.
5. Include costs that do not appear where you expect
A common source of confusion is assuming that all work associated with a SQL warehouse will appear in the same warehouse-cost view.
For example, Databricks notes that materialized-view refreshes are among the costs teams miss most often, because they bill as serverless pipeline usage rather than SQL warehouse usage. A team looking only at warehouse spend could therefore miss an important part of the cost of maintaining its data products.
The general lesson is to map each workload to the relevant billing dimensions and SKU before building dashboards or budget rules. Include refresh pipelines, scheduled jobs, and other supporting compute where they contribute to the workload’s total cost.
Cost attribution is most useful when it follows the product or business capability, not merely the compute resource that happens to be easiest to chart.
6. Turn visibility into engineering action
Monitoring can explain where money went, but reducing the bill requires changes to the work being performed.
Start with a short, repeatable review:
Find the largest cost drivers. Rank usage by warehouse, team, SKU, and workload. Investigate sudden increases before optimizing small, stable workloads.
Inspect the workload, not just the warehouse. Look for excessive scans, repeated queries, unnecessary refreshes, inefficient joins, and concurrency patterns that do not match business demand.
Review serverless settings and workload fit. Serverless can reduce idle-compute overhead and operational effort, but actual savings depend on the workload, pricing, usage pattern, and configuration. Benchmark representative workloads rather than assuming one warehouse type is always cheapest.
Optimize table maintenance and data layout. For Unity Catalog managed tables, evaluate Databricks predictive optimization and applicable layout features. Confirm eligibility and current behavior in the documentation before making them part of a platform standard. (If the same platform also runs batch vector workloads, the NEAREST BY join is a good example of moving work into the query engine rather than paying for a separate service.)
Make ownership explicit. Every recurring production workload should have an owner, an expected usage profile, and a process for reviewing material cost changes.
Databricks has published customer examples describing cost and performance improvements after adopting SQL Serverless, and examples of teams that built cost monitoring and forecasting directly on system tables. Those results are useful illustrations of potential outcomes, not universal guarantees. Your own baseline, workload mix, and contract determine whether a migration or tuning change produces similar results.
A practical implementation checklist
For a data platform team starting from scratch, the sequence matters more than the number of dashboards.
- Define standard tag keys and allowed values for teams, cost centres, environments, and use cases.
- Enforce required tags with the appropriate supported policies or provisioning controls.
- Identify which system-table fields connect usage to resources and owners.
- Import the usage dashboard and verify permissions, pricing assumptions, and data coverage.
- Create team-level budgets plus an account-wide monitoring target.
- Add threshold, pacing, and unattributed-usage alerts.
- Validate query-level attribution against representative workloads before using it for chargeback.
- Include relevant serverless pipelines and refresh workloads in the cost model.
- Define alert owners, response times, escalation paths, and approved corrective actions.
- Review major cost drivers on a recurring schedule and measure the effect of changes.
Limitations and open questions
Databricks’ tooling improves cost observability, but some operational responsibilities remain with the organization:
- Budgets are not hard caps. A threshold breach does not automatically stop execution or prevent charges.
- Attribution depends on metadata quality. Missing or inconsistent tags can weaken team-level reporting, even when billing records are available.
- Query-level costs require careful correlation. Shared compute and billing granularity can make per-query estimates less straightforward than warehouse-level totals.
- Estimates depend on pricing assumptions. Contract-specific rates and SKU mappings should be validated before reports are treated as financial truth.
- Coverage varies by workload type. Warehouse-only views may not capture all costs associated with serverless pipelines or other supporting compute.
- Feature availability can change. Preview features, policies, and dashboard versions should be checked against the current documentation and workspace configuration.
The unresolved engineering challenge is not simply producing a better cost chart. It is connecting cost signals to reliable ownership and proportionate action without disrupting production workloads.
Key takeaways
- Treat budgets as early-warning mechanisms, not spending ceilings. Pair them with a clear response process and independent workload controls.
- Build attribution into provisioning. Standard tags and the appropriate enforcement policies are more reliable than expecting every engineer to remember them.
- Separate warehouse visibility from query-level analysis. Use query tags and correlate query metadata with billing records carefully, and document the limitations of the resulting estimates.
- Understand the dashboard’s coverage. Retention, permissions, adjustable pricing, and aggregation limits affect how the data should be used.
- Optimize the workload, not just the report. The goal is to reduce unnecessary compute while preserving the reliability and performance that users need.
Databricks’ cost-governance capabilities provide a stronger foundation for understanding SQL Serverless spend. The final step still belongs to platform and data engineering: make ownership explicit, detect overruns early, and turn the evidence into safe, measurable changes.
Sources
- Databricks Blog: Set Budgets and Alerts for Cloud Data Warehouse Costs, Shweta Verma and Lingeshwaran Kanniappan (October 7, 2026)
- Databricks documentation: Usage dashboards
- Databricks documentation: Use tags to attribute and track usage
- Databricks documentation: Cost management tools on Databricks

Discussion
Join the discussion: create a free account or sign in to comment.
No comments yet.