Real-Time Energy Trading on Databricks: One Governed Data Copy for the Desk, Risk and ML
Databricks streams market data with Real-Time Mode into Lakebase Postgres, serves the trading desk from it, and trains models and runs analytics on the same governed copy. Here is how the pieces fit, and how to wire an app to Lakebase.

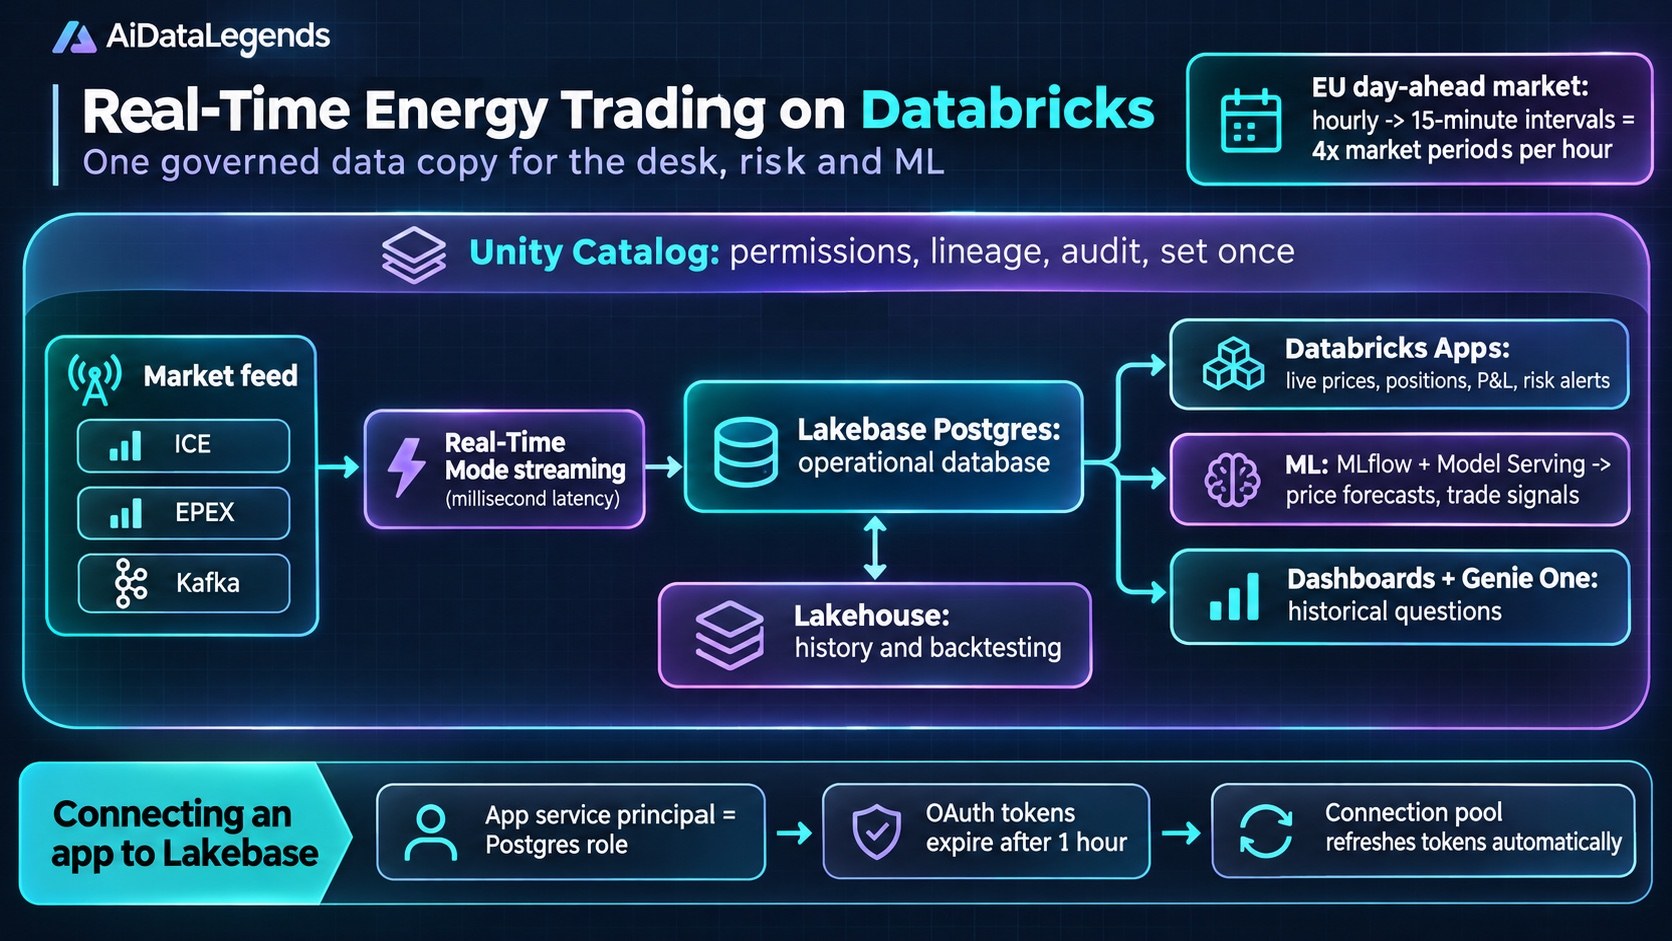
Energy trading teams often run two stacks: an operational system for the live desk and a separate analytical system for backtesting, machine learning and reporting. Databricks has published a reference solution that puts both on one platform, with every workload reading the same governed copy of the data [1]. The pressure behind it is real. The EU day-ahead electricity market has moved from hourly to 15-minute trading intervals, which means four times as many market periods per hour and more records, orders and risk recalculations to keep current [1:1].
Why it matters
Stale data on a trading desk is a risk problem, not an inconvenience. Databricks points out that it can make risk controls reflect an earlier state of the market, contribute to missed intraday moves and put desk limits out of sync with positions [1:2]. Splitting live and analytical work across two systems also means synchronization pipelines, governance and lineage maintained twice, and models trained on data that may not match what the desk sees [1:3].
For data engineers, the pattern is broader than energy: any team running a low-latency operational app next to analytics and ML faces the same choice between two systems kept in sync and one platform serving both.
The architecture
Data flows from a market feed to governed insight in a straight line [1:4]:
- Market feed. Sources such as ICE, EPEX or a Kafka stream provide events.
- Spark Structured Streaming Real-Time Mode processes them continuously, with millisecond latency.
- Lakebase, Databricks’ managed serverless Postgres, is the operational (OLTP) database for millisecond reads, transactions and upserts. The same data is available to the lakehouse for historical analysis and backtesting.
- Databricks Apps hosts the live trading interface, showing prices, positions, P&L, risk, alerts and model outputs straight from Lakebase.
- Machine learning models train on the same data, are tracked with MLflow and deployed through Model Serving; their forecasts and trade signals surface in the app.
- Dashboards and Genie One, Databricks’ natural-language query tool, cover historical analysis.
- Unity Catalog applies permissions, lineage and audit across all of it, configured once.
The key design choice is that no component keeps its own copy of the data [1:5].
What the demo shows
The demo app tracks Brent crude, German and French power, EUR/USD, EU carbon allowances and TTF gas. When a risk measure approaches a desk limit, the app raises an alert, replacing a nightly batch job that calculated risk from an earlier snapshot [1:6]. A real-time price forecast feeds a trade signal, and an analyst asks Genie One for the top five counterparties by trade count with buy and sell volume for each [1:7].
How it works: connecting an app to Lakebase
The companion tutorial shows the plumbing behind step 4 [2]:
- Identity. Each Databricks app gets a service principal. Its
DATABRICKS_CLIENT_IDbecomes the app’s Postgres username. - OAuth instead of passwords. The
databricks_authextension lets Postgres roles accept Databricks tokens. You create a role for the service principal and grant it access, including explicit table grants, because service principals do not inherit default schema permissions. - Token rotation. Lakebase OAuth tokens expire after one hour. The app uses a connection pool with a custom connection class that generates a fresh credential each time it opens a connection, so it never uses an expired token.
- Same code locally and in production. Locally the app runs as your user account; deployed, it runs as its service principal. Only the identity changes.
The example uses Flask, but the rotation pattern works with any framework [2:1].
What data and AI engineers should do
- Map your duplicated work first. List every pipeline that copies data between your operational and analytical systems, and every place permissions are configured twice. That list is the case for, or against, consolidating.
- Check freshness where it matters. If risk limits are computed from a nightly snapshot, that is the first workload to move to a streaming path.
- Get the Lakebase auth right early. Create a dedicated Postgres role per app, grant table permissions explicitly, and use a pool that refreshes tokens, so the one-hour expiry never surfaces as an outage.
- Keep models on the same data as the desk. Training on the governed copy removes the question of whether a training snapshot matches the live view.
Limitations and open questions
This is a vendor reference solution with a demo, not a production case study: it gives no latency, throughput or cost figures under real market load. Consolidating also concentrates risk. If the single streaming path into Lakebase fails, both the live desk and analytics are affected, and the post does not describe failover. Teams with large existing investments in a separate OLTP database or streaming platform will need to weigh migration effort against the savings in duplicated pipelines.
Key takeaways
- The EU day-ahead market’s move to 15-minute intervals creates four times as many market periods per hour. [1:8]
- Databricks’ design streams market data with Real-Time Mode into Lakebase Postgres and serves the desk, analytics and ML from that one copy. [1:9]
- Unity Catalog sets permissions, lineage and audit once for every workload. [1:10]
- Apps connect to Lakebase with service-principal OAuth tokens that expire hourly, refreshed automatically by the connection pool. [2:2]
Sources
Databricks Blog, “Real-time energy trading and analytics on Databricks”, 2026-10-24. https://www.databricks.com/blog/real-time-energy-trading-and-analytics-databricks ↩︎ ↩︎ ↩︎ ↩︎ ↩︎ ↩︎ ↩︎ ↩︎ ↩︎ ↩︎ ↩︎
Databricks Documentation, “Connect a custom Databricks app to Lakebase”. https://docs.databricks.com/aws/en/oltp/projects/tutorial-databricks-apps-autoscaling ↩︎ ↩︎ ↩︎

Discussion
Join the discussion: create a free account or sign in to comment.
No comments yet.